Changing rates
Inspired by a conversation on Twitter I went looking for an archive of freelance journalism word rates. Fortunately the fine people at the…
Inspired by a conversation on Twitter I went looking for an archive of freelance journalism word rates. Fortunately the fine people at the NUJ’s London Freelance branch maintain just that, and all the data that follows is entirely thanks to their hard work.
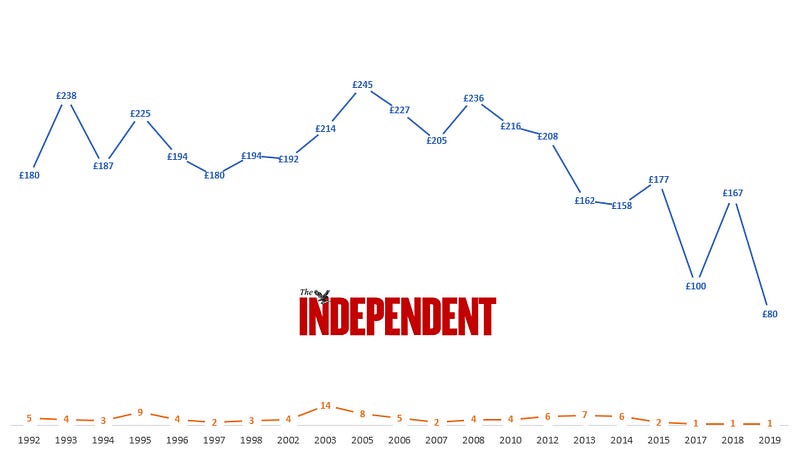
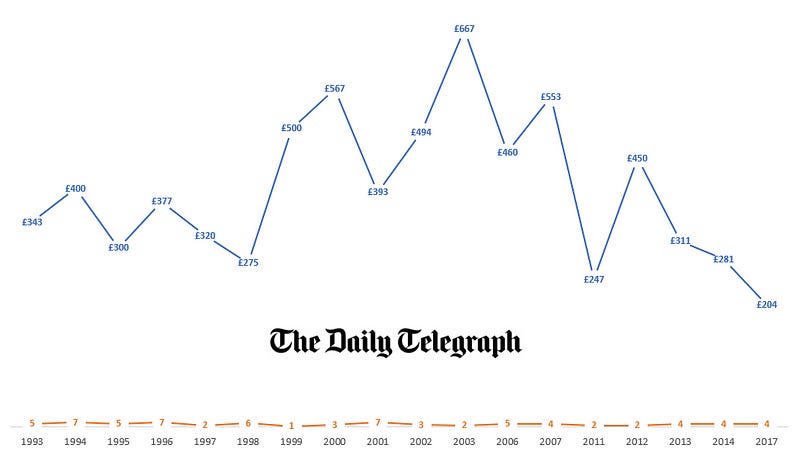
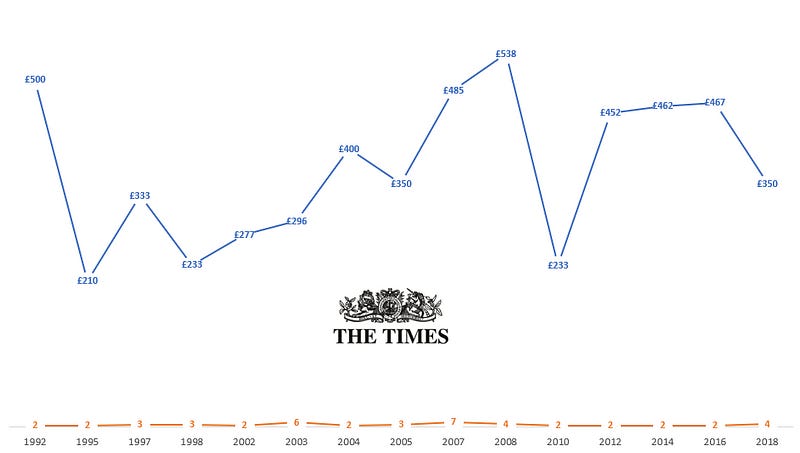
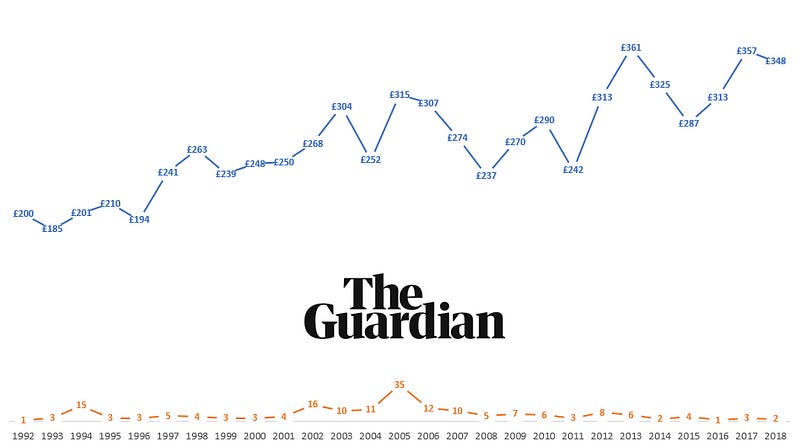
Below, I’ve taken the word rates for the Independent, Guardian, FT, Telegraph and Times according to the NUJ LFB’s list, averaged them out by year and graphed them. Some notes and caveats:
All rates are £ per 1,000 words.
In all cases, rates don’t differentiate between print and online, where they differ.
For all three papers, I removed data for years in which there was only one entry — except for the 2017, 2018 and 2019 Independent entries, because otherwise it would have stopped short, and also the drop-off is quite alarming, and as we all know, you shouldn’t let the facts get in the way of the story. See also the note below about the FT.
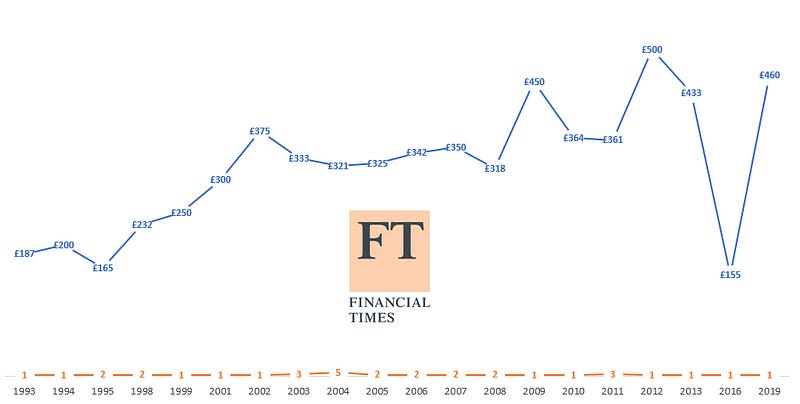
In any case, n for any given year is low, as you can see from the orange (lower) line in each chart, which shows how many entries make up that year’s average.
The data is not all that clean, and it’s not clear that in each case the person was correctly entering the £/1,000 rate. I haven’t done any cleansing of the data to try to correct for this.
The samples are entirely self-selected, in that the tables are compiled from people who’ve been kind enough to enter their rates into the database. So it could be entirely skewed by the kind of freelancers who would do that, and who have time to do it. Also, if n=2 for a particularly low or high year it’s entirely possible that both of those rates were submitted by the same person who might be on a particularly high or low rate.
The site itself has a good disclaimer that covers all this and more.
Given all that, I’m not sure any of this has much scientific validity, but I was bored for an hour and thought I may as well put this online now I’ve worked it out.
Finally, a disclosure notice: the only one of these I’ve done freelance work or shifts for is The Guardian (or The Observer, as was), between 10 and 15 years ago. I can’t remember my rates. I once had a job interview for The Times graduate scheme, which I fluffed badly.
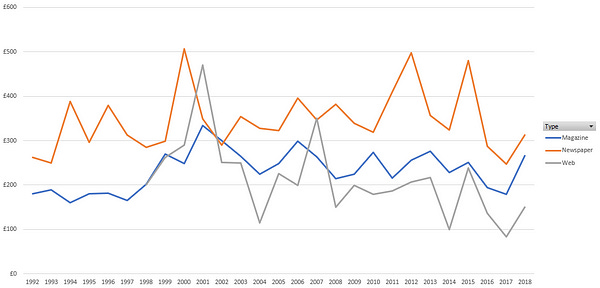
Finally, I’ve taken the full dataset for each of newspapers, magazines and the web and averaged those per year. Here I’ve removed rates that were not in GBP and rates marked “US author” in the data, where it was significantly higher than most other people were getting.
What I was looking for in the single-newspaper data was a downward trend, peaking around the mid-2000s, and what I found was perhaps more interesting than that.
If you discount the last three years, the Independent hasn’t moved that much, but then it seems to have broadly been paying less than the other two papers in any case. The drop-off since it went web-only does seem quite large.
The Telegraph had a big peak between 1999 and 2009 and then has also dropped off quite remarkably.
The Times is an interesting one. Rates broadly increase up to around 2008, and then take a drop in 2010, but then recover reasonably well. Is the fact that The Times has been behind the paywall for that time, and the fact that it’s never really taken the web all that seriously in any case, a factor here?
The Guardian’s chart is also interesting, pretty much showing rates steadily increasing over time. The n is higher here than for the other papers, by and large.
Finally, the FT’s chart doesn’t tell us much because there are so few data points.
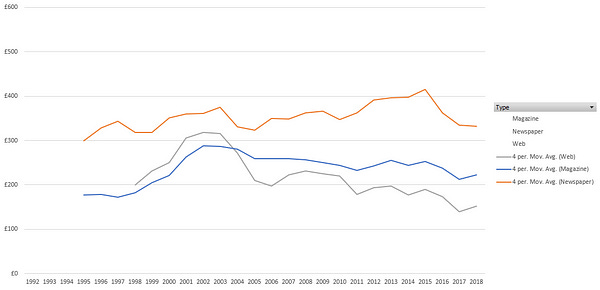
The aggregated numbers are much less clear. Obviously there’s a lot of noise in this data, and it’s even less clear than it was for the single-paper data that I’m comparing like for like. It certainly doesn’t show the same sort of shape as for the Telegraph and The Independent. There’s also an odd uptick in 2018 which suggests rates are going up in all three formats. After the main graph I’ve added a four-year moving average to try and make it clearer, and this shows newspapers and magazines roughly holding steady, while online publications have been on a downward trend for nearly 20 years.
Let me know what you think, particularly if I’ve made mistakes or bad assumptions anywhere.


